Miami Dolphins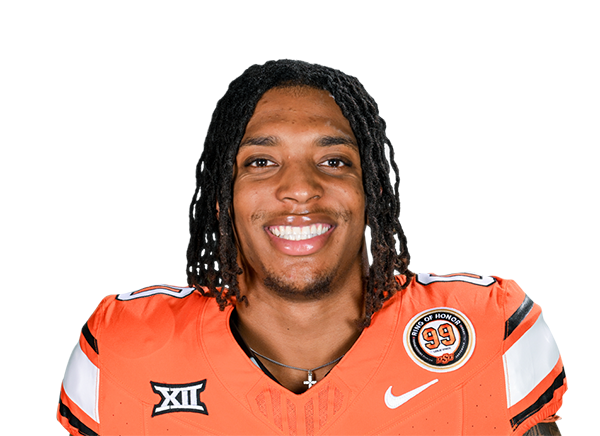
 RB · #0
Ollie Gordon II
Height
6' 2"
Weight
225 lbs
Age
22
College
Oklahoma State
Experience
2nd Season
B
SALCI index
2026 · through week 5 · 4 games
60
index
B — top 40% of 65 qualifying RB
Usage46
Efficiency80
Scoring69
Where he stands across games already played, weighted by what persists. The whole board.
Usage
2026 · 4 games · MIAShare of his own offense — the part of production that carries to next week.
Target share
3.9%
5 targets
Air-yards share
-1.2%
-16 air yds
Catch rate
100.0%
5 catches
Yards / rec
2.8
Yards / carry
5.0
47 carries
EPA / touch
0.059
expected points added
The target room
Who arrived and who left MIA since 2026, and what each of them commanded of their own offencethat year. Observed shares — nobody's projection. The totals are share points brought in from elsewhere, not a percentage of MIA's targets.
Arrived7 pts
- Jared WayneWR · from HOU7.0%
Left0 pts
Nobody with meaningful prior usage.
Across 1,570 incumbent receiver seasons since 1999, an arrival this size cost the incumbent about 0.2 points of target share — against a year-to-year swing of ±4.6. Real, and far smaller than the noise it sits in.
The other half of the intuition — that a defence can no longer double him — was tested on the same seasons and did not appear: the effect on yards per target was -0.003 to 0.006, an interval straddling zero.
What actually moves a target share year to year is reversion: shares are pulled toward 19.1%, and that term is several times larger than anything the roster did. How we measured it
How often he cleared it
2026His own rushing yards game log, counted against three round numbers either side of his median. No model and no projection — these are games he has already played. We show it because a player’s own history is the thing our receptions model failed to beat. The receipts.
Cleared 49.5 rushing yards in 2 of 4 games2 of 4
Cleared 59.5 rushing yards in 2 of 4 games2 of 4
Cleared 69.5 rushing yards in 2 of 4 games2 of 4
Passing
2026Pass Yards
0
Touchdowns
0
INT
0
CMP%
0.0
RTG
0.0
PYDS/G
0.0
Rushing
2026Rush Yards
236
Rushing Touchdowns
3
Rushing Attempts
47
YDS/RA
5.0
LONG
53
YDS/G
47.2
Receiving
2026Receptions
5
Rec. Yards
14
Receiving Touchdowns
0
YDS/R
2.8
TGT
5
LONG
19
Scoring
2026TTD
3
TP
18