Week 160.5 points short of 3
Houston TexansatPhiladelphia Eagles
Thursday, Dec 24, 8:15 PM ET
Opened
-2.5
First seen Sep 26
Now
-2.5
Unmoved
Total
37.5
Prices archived
12
2 spread · 2 total
Where the best number is
PHI-2.5DraftKings
HOU+2.5DraftKings
Over37.5DraftKings
Under38.5FanDuel
Across the 2 books we archive — which is a real limit on this, and we would rather say so than imply a survey of the market. Lines only: two books on the same number with different juice read as equal here.
What the market says
Both prices with the bookmaker's margin removed. This is the market's number, not ours — we don't forecast NFL games, and we publish why.
HOU
45.3%
PHI
54.7%
Teams the market priced at 50–55% won 341 of 644 games since 1999.That is almost exactly what the price claimed — this market prices accurately.
4.1%the book's margin on this game
The two prices add up to 104.1%. Everything over 100% is the book's edge, taken whichever side you pick.
Head to head
HOU skill corpswho they facePHI skill corps
138.5
Receivers
184.5yds/gm allowed · vs PHI / vs HOU
statements like this held next week 54.6%· CI 50.7–58.5
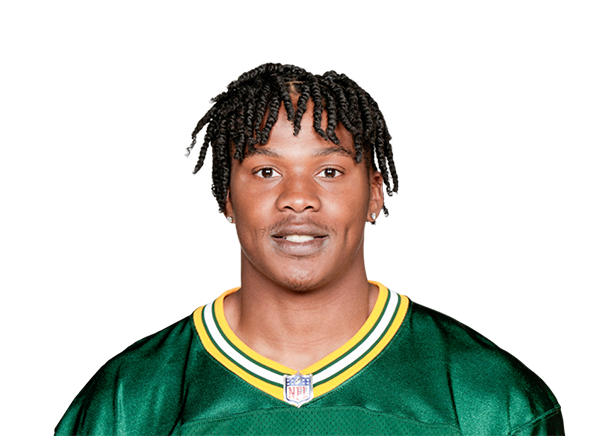
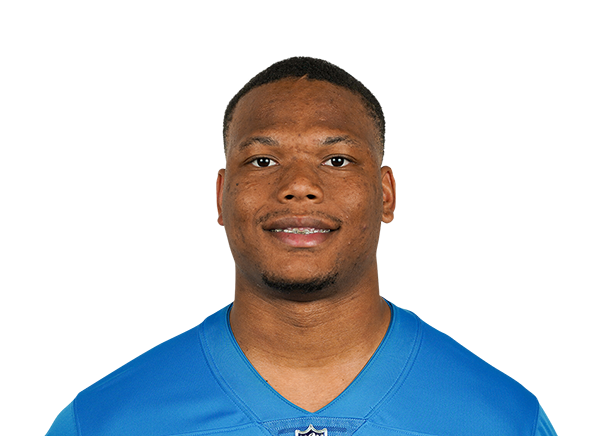
 Xavier Hutchinson17.2% target share · 6.5 PPR last 2
 Nico Collins11.5% target share · 21.2 PPR last 1
 Jared Wayne9.2% target share · 3.8 PPR last 2
The life of this number: the DraftKings spread opened -2.5 on Sat, Sep 26, 90 days before kickoff and has not moved since.
What happened at this number
Counts from 6,967 regular-season games since 1999. No model, no forecast — this is the history of the number itself, not a claim about this game.
The spread
Favourites of 2.5 covered 244 of 504 games.
The range covers a coin flip.
They won outright in 269 of 504.
The total
Totals of 37.5 went over 101 of 189 times.
The range covers a coin flip.
How often a game ends on each margin
3
1,046 of 6,967
7
634 of 6,967
6
415 of 6,967
The spread, hour by hour
Home handicap. Dashed rules are the key numbers.
DraftKingsFanDuel
Hover or drag to replay
The total
Over line.
DraftKingsFanDuel
Hover or drag to replay
Player props
The books haven't posted player props for this game yet — normal this far out. The archive is already watching for them: the moment a price appears it is captured, kept forever, and becomes loggable here.
When they land you'll get the same book you get on the game lines — closing-line value, a letter grade and a good-bet verdict on every prop you log. No projections: our prop model failed its own pre-registered calibration gate, and we don't ship numbers that failed.
Every point above is a price we observed and stored, with the time we saw it. Nothing on this page is a prediction, a rating, or a recommended bet.