Only DraftKings quotes this game so far, so there is no second number to compare it against. Books further out post one at a time; this fills in as kickoff gets closer.
What the market says
Both prices with the bookmaker's margin removed. This is the market's number, not ours — we don't forecast NFL games, and we publish why.
JAX
53.2%
NYG
46.8%
Teams the market priced at 50–55% won 341 of 644 games since 1999.That is almost exactly what the price claimed — this market prices accurately.
4.3%the book's margin on this game
The two prices add up to 104.3%. Everything over 100% is the book's edge, taken whichever side you pick.
Head to head
Trevor Lawrence · JAXQB Index componentsJameis Winston · NYG
51 · C
Index
52 · C
28.6
Attempts / gm
33.0
6.5%
Sacked
share of dropbacks
7.7%
67.1%
QB Index · vs NYG
Trevor Lawrence
JAX · 5 games, 143 attempts
51
index
C
Volumeweight 0.40
24th of 34
28.6 attempts per game · team runs 57 plays at 51% pass · sacked on 6.5% of dropbacks
Efficiencyweight 0.35
4th of 34
8.2 yards per attempt · 67.1% completions · 0.274 EPA per dropback
Matchupweight 0.25
23rd of 32
NYG has allowed 6.5 yards per attempt across 5 games
≈ 219 yards
The life of this number: the DraftKings spread opened +1.5 on Mon, Aug 24, 90 days before kickoff and has not moved since.
What happened at this number
Counts from 6,967 regular-season games since 1999. No model, no forecast — this is the history of the number itself, not a claim about this game.
The spread
Favourites of 1.5 covered 99 of 194 games.
The range covers a coin flip.
They won outright in 104 of 194.
The total
Totals of 46.5 went over 121 of 239 times.
The range covers a coin flip.
How often a game ends on each margin
3
1,046 of 6,967
7
634 of 6,967
6
415 of 6,967
The spread, hour by hour
Home handicap. Dashed rules are the key numbers.
Only one price recorded so far — nothing to plot until it moves.
The total
Over line.
Only one price recorded so far — nothing to plot until it moves.
Player props
The books haven't posted player props for this game yet — normal this far out. The archive is already watching for them: the moment a price appears it is captured, kept forever, and becomes loggable here.
When they land you'll get the same book you get on the game lines — closing-line value, a letter grade and a good-bet verdict on every prop you log. No projections: our prop model failed its own pre-registered calibration gate, and we don't ship numbers that failed.
Every point above is a price we observed and stored, with the time we saw it. Nothing on this page is a prediction, a rating, or a recommended bet.
Completion
57.6%
8.2
Yards / att
6.1
224.8
Air yards / gm
317.5
0.274
EPA / dropback
-0.057
+7.7
CPOE
completion % over expected
-7.3
Every row is a rate measured over games already played, never a probability — the same components behind each quarterback's Index below. Our passing model failed its calibration test; we publish that on the accuracy page.
Expected volume from the inputs above. Unvalidated — it is arithmetic on what has already happened, not a forecast that has been scored against outcomes.
The market has his team at 24.0 points implied.
What he has actually cleared
200.5 yards in 3 of 5225.5 yards in 3 of 5250.5 yards in 1 of 5
The index ranks this quarterback and this matchup against every qualifying passer, over games already played. It is not a probability and not a bet — our passing-yards model failed its calibration test, and we publish that on the accuracy page.
QB Index · vs JAX
Jameis Winston
NYG · 4 games, 132 attempts
52
index
C
Volumeweight 0.40
13th of 34
33.0 attempts per game · team runs 63 plays at 53% pass · sacked on 7.7% of dropbacks
Efficiencyweight 0.35
28th of 34
6.1 yards per attempt · 57.6% completions · -0.057 EPA per dropback
Matchupweight 0.25
8th of 32
JAX has allowed 7.7 yards per attempt across 5 games
≈ 187 yards31 attempts × 6.1 yards per attempt
Expected volume from the inputs above. Unvalidated — it is arithmetic on what has already happened, not a forecast that has been scored against outcomes.
The market has his team at 22.5 points implied.
What he has actually cleared
225.5 yards in 2 of 4250.5 yards in 1 of 4275.5 yards in 1 of 4
The index ranks this quarterback and this matchup against every qualifying passer, over games already played. It is not a probability and not a bet — our passing-yards model failed its calibration test, and we publish that on the accuracy page.
10
390 of 6,967
4
341 of 6,967
14
334 of 6,967
Across 6,967 regular-season games since 1999, 24 of 28 spread rungs with a usable sample had a 95% interval containing 50%. In other words the number itself has never been an edge, at any rung, in twenty-seven seasons. What it is good for is knowing which numbers are expensive to cross — and a rung holding fewer than 30 games is shown greyed rather than dropped.
 Parker Washington25.4% target share · 15.6 PPR last 4
 Jakobi Meyers13.0% target share · 8.8 PPR last 4
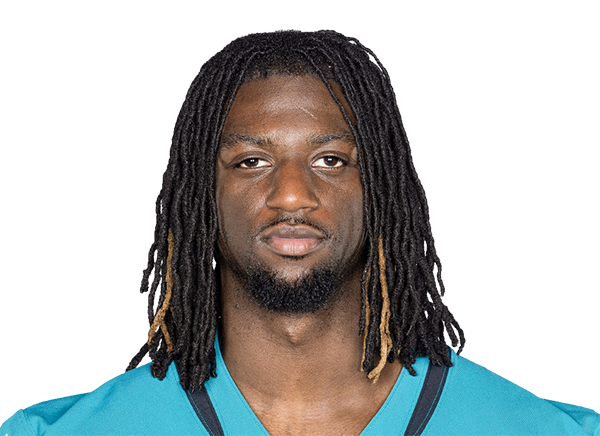 Brian Thomas Jr.13.0% target share · 4.6 PPR last 4
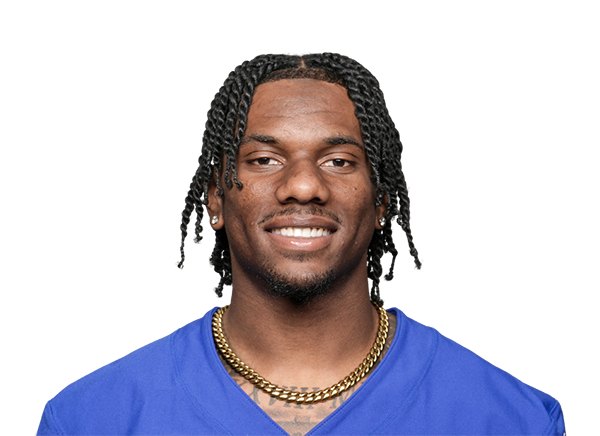 Malik Nabers28.0% target share · 15.3 PPR last 4
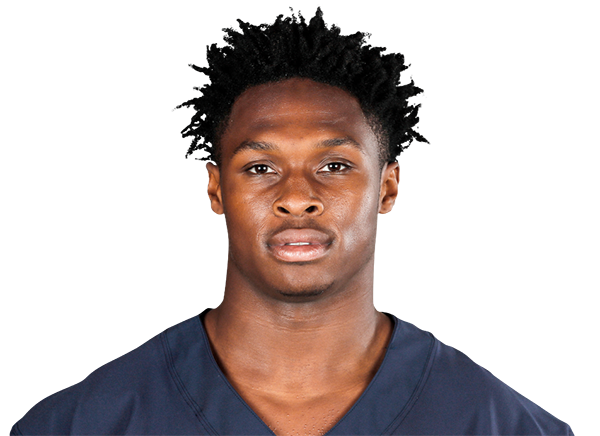 Darnell Mooney10.4% target share · 3.8 PPR last 4
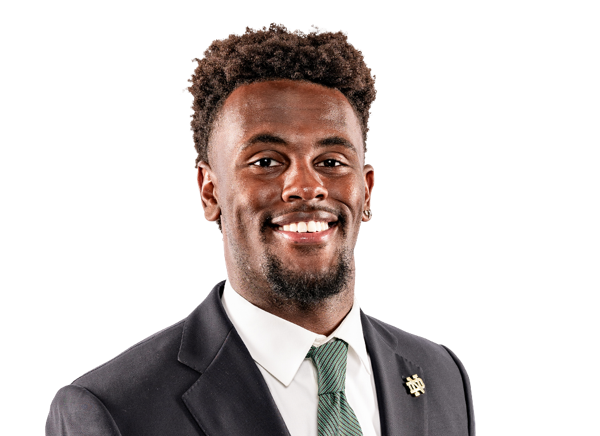 Malachi Fields10.4% target share · 6.5 PPR last 4
 Bhayshul Tuten61.2% of team carries · 13.5 PPR last 4
 Chris Rodriguez Jr.20.9% of team carries · 5.7 PPR last 4
 Ameer Abdullah7.5% of team carries · 0.6 PPR last 4
 Cam Skattebo57.4% of team carries · 9.3 PPR last 4
 Brenton Strange18.8% target share · 10.1 PPR last 4
 Nate Boerkircher4.3% target share · 2.1 PPR last 4
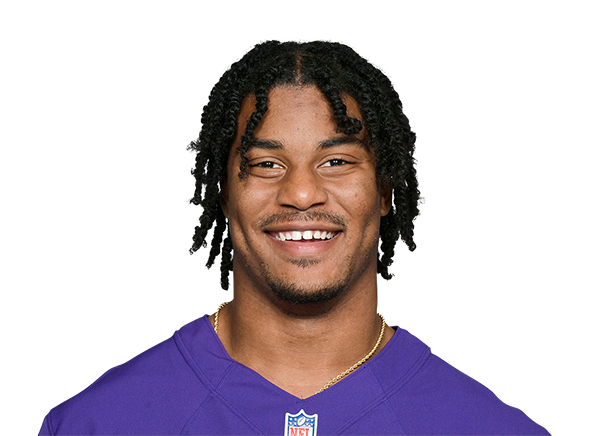 Isaiah Likely29.3% target share · 14.4 PPR last 4
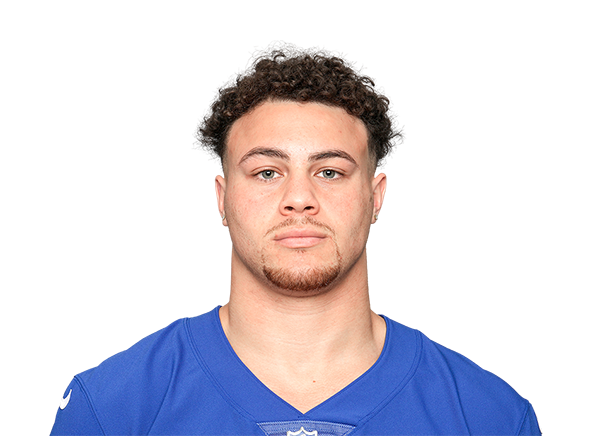 Theo Johnson5.5% target share · 3.9 PPR last 4