Crossed 3 since opening1 point gap between books right now
Where the best number is
PHI+5.5FanDuel
DAL-4.5DraftKings
Over44.5DraftKings
Under45.5FanDuel
Across the 2 books we archive — which is a real limit on this, and we would rather say so than imply a survey of the market. Lines only: two books on the same number with different juice read as equal here.
What the market says
Both prices with the bookmaker's margin removed. This is the market's number, not ours — we don't forecast NFL games, and we publish why.
DAL
66.9%
PHI
33.1%
Teams the market priced at 65–70% won 506 of 752 games since 1999.That is almost exactly what the price claimed — this market prices accurately.
4.2%the book's margin on this game
The two prices add up to 104.2%. Everything over 100% is the book's edge, taken whichever side you pick.
Head to head
Dak Prescott · DALQB Index componentsJalen Hurts · PHI
70 · A
Index
50 · C
38.4
Attempts / gm
30.8
3.0%
Sacked
share of dropbacks
7.8%
67.2%
Completion
QB Index · vs PHI
Dak Prescott
DAL · 5 games, 192 attempts
70
index
A
Volumeweight 0.40
5th of 34
38.4 attempts per game · team runs 60 plays at 64% pass · sacked on 3.0% of dropbacks
Efficiencyweight 0.35
12th of 34
7.2 yards per attempt · 67.2% completions · 0.229 EPA per dropback
Matchupweight 0.25
18th of 32
PHI has allowed 7.0 yards per attempt across 5 games
≈ 268 yards
The life of this number
Following the DraftKings spread · one of 2 books archived · 4 prices on record
Open
Opened -3 on Wed, Jul 29, 90 days before kickoff.
Move
3 reprices since, 9.5 points of movement in all. It sits +4.5 — the favourite changed sides. It ranged from -3 to +5.5 along the way, retracing 2 points of that movement.
When it moved
Half of the movement was over by Sun, Oct 18, 8 PM ET.
100% 5+ days out
Biggest move
7 points at once — -1.5 to +5.5 on Sun, Oct 18, 8 PM ET.
Crossed 3
-1.5 to +5.5 on Sun, Oct 18, 8 PM ET — through 3 and away from it.
Held 3
It sat on 3 for 77 days, then left it on Tue, Oct 13, 8 PM ET.
Every sentence above is arithmetic on prices we recorded and the times we recorded them. Nothing here says where this number goes next.
The life of this number
Following the DraftKings total · one of 2 books archived · 3 prices on record
Open
Opened 48.5 on Wed, Jul 29, 90 days before kickoff.
Move
2 reprices since, 4 points of movement in all. It sits 44.5 — 4 points lower than the open.
When it moved
Half of the movement was over by Sun, Oct 18, 8 PM ET.
100% 5+ days out
Biggest move
3 points at once — 47.5 to 44.5 on Sun, Oct 18, 8 PM ET.
Every sentence above is arithmetic on prices we recorded and the times we recorded them. Nothing here says where this number goes next.
What happened at this number
Counts from 6,967 regular-season games since 1999. No model, no forecast — this is the history of the number itself, not a claim about this game.
The spread
Favourites of 4.5 covered 127 of 254 games.
The range covers a coin flip.
They won outright in 169 of 254.
The total
Totals of 44.5 went over 129 of 294 times.
The range clears a coin flip.
How often a game ends on each margin
3
1,046 of 6,967
7
634 of 6,967
6
415 of 6,967
The spread, hour by hour
Home handicap. Dashed rules are the key numbers.
DraftKingsFanDuel
Hover or drag to replay
The total
Over line.
DraftKingsFanDuel
Hover or drag to replay
Player props
The books haven't posted player props for this game yet — normal this far out. The archive is already watching for them: the moment a price appears it is captured, kept forever, and becomes loggable here.
When they land you'll get the same book you get on the game lines — closing-line value, a letter grade and a good-bet verdict on every prop you log. No projections: our prop model failed its own pre-registered calibration gate, and we don't ship numbers that failed.
Every point above is a price we observed and stored, with the time we saw it. Nothing on this page is a prediction, a rating, or a recommended bet.
57.8%
7.2
Yards / att
6.1
288.2
Air yards / gm
231.8
0.229
EPA / dropback
-0.058
+3.0
CPOE
completion % over expected
-2.5
Every row is a rate measured over games already played, never a probability — the same components behind each quarterback's Index below. Our passing model failed its calibration test; we publish that on the accuracy page.
Expected volume from the inputs above. Unvalidated — it is arithmetic on what has already happened, not a forecast that has been scored against outcomes.
The market has his team at 24.5 points implied.
What he has actually cleared
250.5 yards in 4 of 5275.5 yards in 4 of 5300.5 yards in 2 of 5
The index ranks this quarterback and this matchup against every qualifying passer, over games already played. It is not a probability and not a bet — our passing-yards model failed its calibration test, and we publish that on the accuracy page.
QB Index · vs DAL
Jalen Hurts
PHI · 5 games, 154 attempts
50
index
C
Volumeweight 0.40
18th of 34
30.8 attempts per game · team runs 55 plays at 56% pass · sacked on 7.8% of dropbacks
Efficiencyweight 0.35
27th of 34
6.1 yards per attempt · 57.8% completions · -0.058 EPA per dropback
Matchupweight 0.25
3rd of 32
DAL has allowed 8.4 yards per attempt across 5 games
≈ 173 yards29 attempts × 6.1 yards per attempt
Expected volume from the inputs above. Unvalidated — it is arithmetic on what has already happened, not a forecast that has been scored against outcomes.
The market has his team at 20.0 points implied.
What he has actually cleared
175.5 yards in 3 of 5200.5 yards in 3 of 5225.5 yards in 1 of 5
The index ranks this quarterback and this matchup against every qualifying passer, over games already played. It is not a probability and not a bet — our passing-yards model failed its calibration test, and we publish that on the accuracy page.
10
390 of 6,967
4
341 of 6,967
14
334 of 6,967
Across 6,967 regular-season games since 1999, 24 of 28 spread rungs with a usable sample had a 95% interval containing 50%. In other words the number itself has never been an edge, at any rung, in twenty-seven seasons. What it is good for is knowing which numbers are expensive to cross — and a rung holding fewer than 30 games is shown greyed rather than dropped.
 CeeDee Lamb27.7% target share · 24.9 PPR last 4
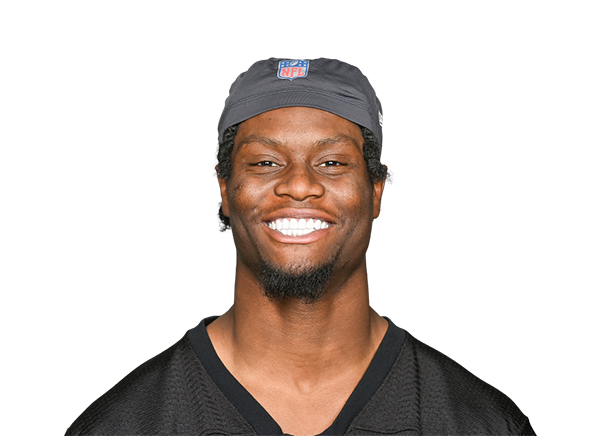 George Pickens21.8% target share · 15.7 PPR last 4
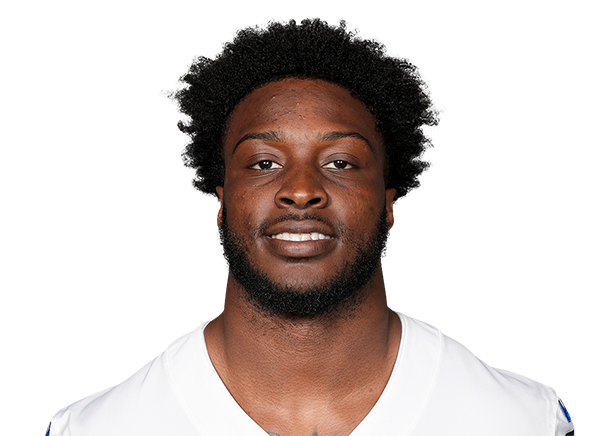 Ryan Flournoy14.9% target share · 7.8 PPR last 4
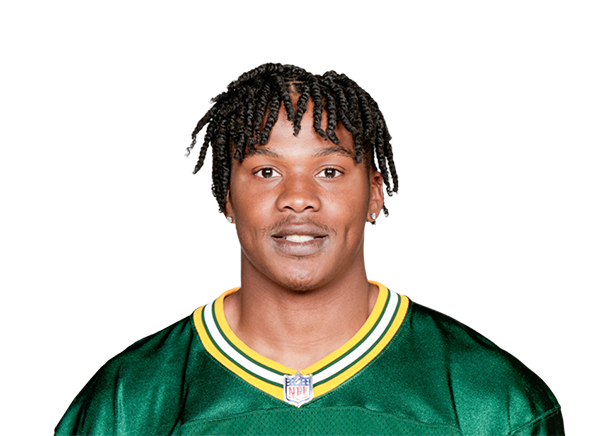 Dontayvion Wicks19.6% target share · 8.4 PPR last 4
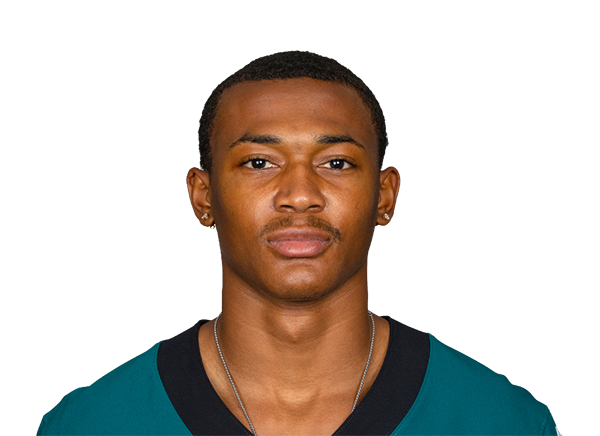 DeVonta Smith18.9% target share · 16.2 PPR last 3
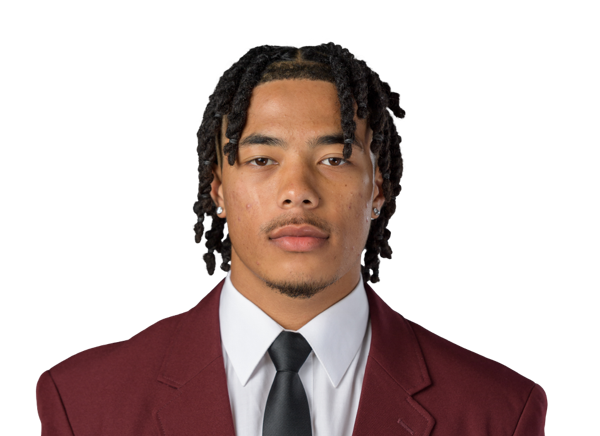 Makai Lemon15.4% target share · 5.7 PPR last 4
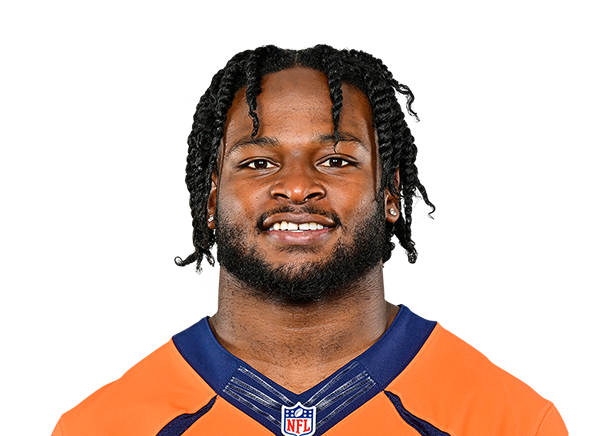 Javonte Williams71.2% of team carries · 17.9 PPR last 4
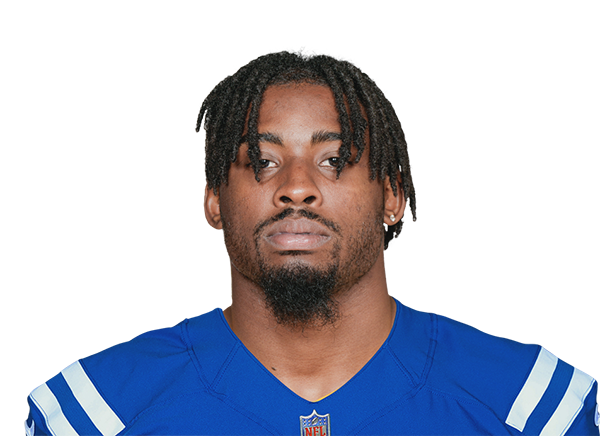 Tyler Goodson8.7% of team carries · 2 PPR last 2
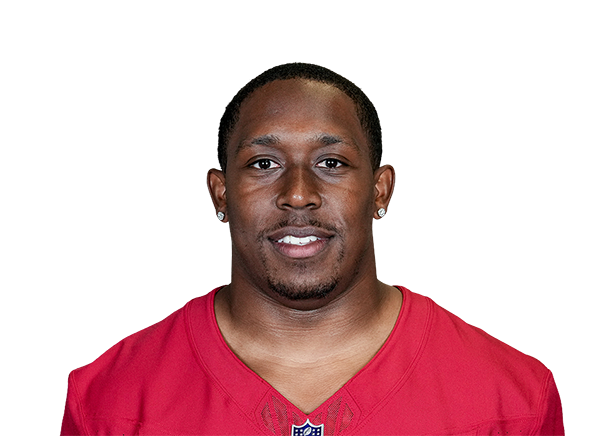 Emari Demercado4.8% of team carries · 0.8 PPR last 2
 Saquon Barkley30.8% of team carries · 5.8 PPR last 4
 Jake Ferguson11.2% target share · 9.7 PPR last 4
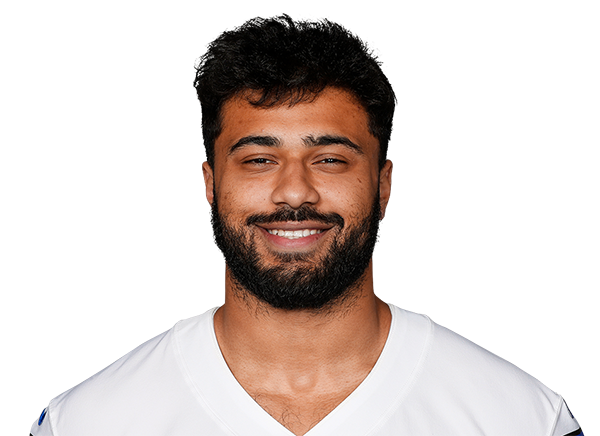 Brevyn Spann-Ford3.2% target share · 0.7 PPR last 4
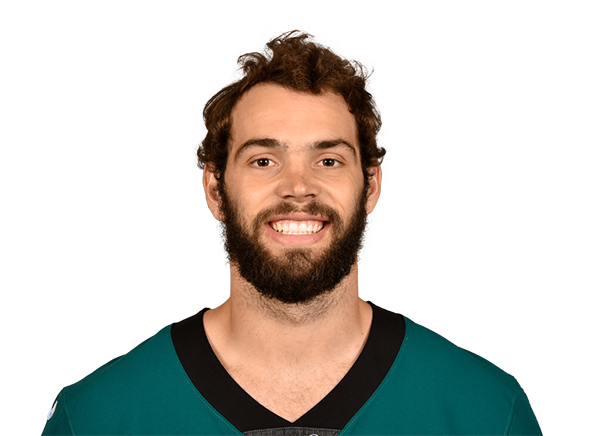 Dallas Goedert11.2% target share · 11.6 PPR last 3
 Zach Ertz5.6% target share · 1.7 PPR last 3