0.5 points short of 30.5 point gap between books right now
Where the best number is
CHI-2.5DraftKings
NE+3FanDuel
Over49.5DraftKings
Under50.5FanDuel
Across the 2 books we archive — which is a real limit on this, and we would rather say so than imply a survey of the market. Lines only: two books on the same number with different juice read as equal here.
What the market says
Both prices with the bookmaker's margin removed. This is the market's number, not ours — we don't forecast NFL games, and we publish why.
NE
41.4%
CHI
58.6%
Teams the market priced at 55–60% won 493 of 879 games since 1999.Slightly worse than the price claimed, by 1.4 points.
4.0%the book's margin on this game
The two prices add up to 104.0%. Everything over 100% is the book's edge, taken whichever side you pick.
Head to head
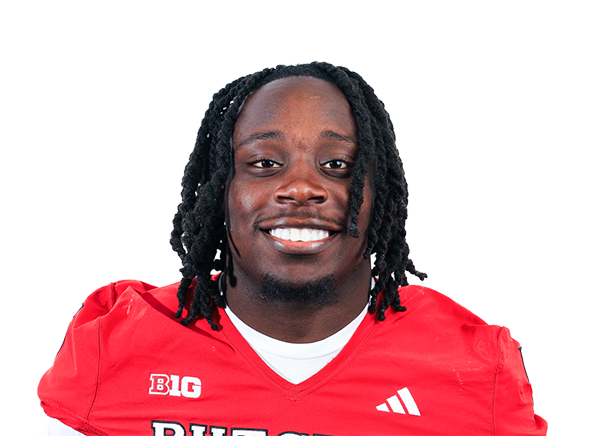
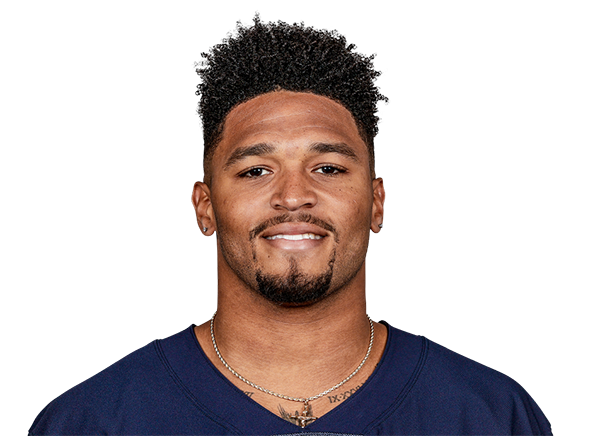
Drake Maye · NEQB Index componentsTyson Bagent · CHI
70 · A
Index
23 · F
30.2
Attempts / gm
21.3
6.8%
Sacked
share of dropbacks
5.9%
65.6%
Completion
QB Index · vs CHI
Drake Maye
NE · 5 games, 151 attempts
70
index
A
Volumeweight 0.40
19th of 34
30.2 attempts per game · team runs 62 plays at 51% pass · sacked on 6.8% of dropbacks
Efficiencyweight 0.35
8th of 34
8.1 yards per attempt · 65.6% completions · 0.126 EPA per dropback
Matchupweight 0.25
2nd of 32
CHI has allowed 8.8 yards per attempt across 5 games
≈ 238 yards
The life of this number
Following the DraftKings spread · one of 2 books archived · 2 prices on record
Open
Opened -1.5 on Wed, Jul 29, 86 days before kickoff.
Move
One reprice since, 1 point of movement in all. It sits -2.5 — the favourite is 1 point bigger than at the open.
When it moved
Half of the movement was over by Sun, Oct 18, 8 PM ET.
100% 5–2 days out
Biggest move
1 point at once — -1.5 to -2.5 on Sun, Oct 18, 8 PM ET.
Every sentence above is arithmetic on prices we recorded and the times we recorded them. Nothing here says where this number goes next.
The life of this number
Following the FanDuel total · one of 2 books archived · 3 prices on record
Open
Opened 49.5 on Tue, Oct 13, 9 days before kickoff.
Move
2 reprices since, 3 points of movement in all. It sits 50.5 — 1 point higher than the open. It ranged from 48.5 to 50.5 along the way, retracing 2 points of that movement.
When it moved
Half of the movement was over by Mon, Oct 19, 2 AM ET.
100% 5–2 days out
Biggest move
2 points at once — 48.5 to 50.5 on Mon, Oct 19, 2 AM ET.
Every sentence above is arithmetic on prices we recorded and the times we recorded them. Nothing here says where this number goes next.
What happened at this number
Counts from 6,967 regular-season games since 1999. No model, no forecast — this is the history of the number itself, not a claim about this game.
The spread
Favourites of 2.5 covered 244 of 504 games.
The range covers a coin flip.
They won outright in 269 of 504.
The total
Totals of 50.5 went over 48 of 86 times.
The range covers a coin flip.
How often a game ends on each margin
3
1,046 of 6,967
7
634 of 6,967
6
415 of 6,967
The spread, hour by hour
Home handicap. Dashed rules are the key numbers.
DraftKingsFanDuel
Hover or drag to replay
The total
Over line.
DraftKingsFanDuel
Hover or drag to replay
Player props · 38
A.J. Brown
Receiving Yards
61.5market 50% over
over
-112
DraftKings
under
-112
DraftKings
A.J. Brown
Receptions
4.5market 56% over
over
-145
DraftKings
under
+113
DraftKings
Caleb Williams
Completions
20.5market 49% over
over
-110
DraftKings
under
-118
DraftKings
Caleb Williams
Interceptions
0.5market 47% over
over
+101
DraftKings
under
-128
DraftKings
Caleb Williams
Pass Attempts
32.5market 50% over
over
-111
DraftKings
under
-115
DraftKings
Caleb Williams
Passing TDs
1.5market 54% over
over
-130
FanDuel
under
+104
DraftKings
Caleb Williams
Passing Yards
241.5market 50% over
over
-111
DraftKings
under
-114
DraftKings
Caleb Williams
Rushing Yards
17.5market 50% over
over
-114
DraftKings
under
-111
DraftKings
Colston Loveland
Receiving Yards
40.5market 50% over
we project22.0/gm± 12.5 typical error
over
-114
FanDuel
under
-114
FanDuel
Colston Loveland
Receptions
3.5market 56% over
over
-149
DraftKings
under
+118
FanDuel
D'Andre Swift
Carries
14.5market 52% over
we project15.6/gm± 3.0 typical error
over
-125
DraftKings
under
-103
DraftKings
D'Andre Swift
Receiving Yards
17.5market 51% over
over
-114
FanDuel
under
-108
DraftKings
D'Andre Swift
Receptions
2.5market 54% over
over
-133
DraftKings
under
+104
DraftKings
D'Andre Swift
Rushing Yards
63.5market 50% over
we project70.8/gm± 15.2 typical error
over
-114
FanDuel
under
-114
FanDuel
Demario Douglas
Receiving Yards
27.5market 50% over
we project29.4/gm± 12.5 typical error
over
-111
DraftKings
under
-114
DraftKings
Demario Douglas
Receptions
2.5market 58% over
over
-161
DraftKings
under
+126
DraftKings
Drake Maye
Completions
20.5market 51% over
over
-119
DraftKings
under
-108
DraftKings
Drake Maye
Interceptions
0.5market 49% over
over
-109
DraftKings
under
-119
DraftKings
Drake Maye
Pass Attempts
31.5market 48% over
we project30.2/gm± 3.0 typical error
over
-104
DraftKings
under
-123
DraftKings
Drake Maye
Passing TDs
1.5market 53% over5.5pp between books — shop it
over
-102
FanDuel
under
-101
DraftKings
Drake Maye
Passing Yards
237.5market 50% over
over
-112
DraftKings
under
-112
DraftKings
Drake Maye
Rushing Yards
29.5market 49% over
we project32.2/gm± 4.9 typical error
over
-110
DraftKings
under
-114
FanDuel
Efton Chism III
Receiving Yards
18.5market 50% over
we project24.5/gm± 12.5 typical error
over
-111
DraftKings
under
-114
DraftKings
Efton Chism III
Receptions
1.5market 62% over
over
-189
DraftKings
under
+146
DraftKings
Hunter Henry
Receiving Yards
32.5market 50% over
we project35.4/gm± 12.5 typical error
over
-112
DraftKings
under
-112
DraftKings
Hunter Henry
Receptions
3.5market 42% over2.3pp between books — shop it
over
+123
DraftKings
under
-148
FanDuel
Kalif Raymond
Receiving Yards
27.5market 50% over
we project45.2/gm± 12.5 typical error
over
-114
FanDuel
under
-114
FanDuel
Kalif Raymond
Receptions
2.5market 53% over
over
-132
DraftKings
under
+102
DraftKings
Luther Burden III
Receiving Yards
56.5market 50% over
we project53.2/gm± 12.5 typical error
over
-114
DraftKings
under
-111
DraftKings
Luther Burden III
Receptions
4.5market 52% over
over
-123
DraftKings
under
-102
FanDuel
Rhamondre Stevenson
Carries
11.5market 47% over
we project11.4/gm± 3.0 typical error
over
+101
DraftKings
under
-130
DraftKings
Rhamondre Stevenson
Receiving Yards
17.5market 50% over
over
-114
FanDuel
under
-114
FanDuel
Rhamondre Stevenson
Receptions
2.5market 55% over1.6pp between books — shop it
over
-130
FanDuel
under
+108
DraftKings
Rhamondre Stevenson
Rushing Yards
41.5market 50% over
we project45.4/gm± 15.2 typical error
over
-114
DraftKings
under
-111
DraftKings
Rome Odunze
Receiving Yards
44.5market 51% over
we project54.6/gm± 12.5 typical error
over
-116
DraftKings
under
-110
DraftKings
Rome Odunze
Receptions
3.5market 42% over1.7pp between books — shop it
over
+124
DraftKings
under
-154
FanDuel
TreVeyon Henderson
Carries
7.5market 46% over
we project10.5/gm± 3.0 typical error
over
+103
DraftKings
under
-132
DraftKings
TreVeyon Henderson
Rushing Yards
29.5market 50% over
we project40.8/gm± 15.2 typical error
over
-114
DraftKings
under
-111
DraftKings
Every number here is a price we observed or arithmetic on prices we observed. “Market %” is the book's own two-sided price with the vig removed — not a forecast. We publish no prop projection: the model failed its pre-registered calibration gate on 2026-07-31, and a number that failed its own test doesn't go on the site.
Every point above is a price we observed and stored, with the time we saw it. Nothing on this page is a prediction, a rating, or a recommended bet.
65.6%
8.1
Yards / att
6.4
277.2
Air yards / gm
144.3
0.126
EPA / dropback
-0.077
+6.2
CPOE
completion % over expected
+1.7
Every row is a rate measured over games already played, never a probability — the same components behind each quarterback's Index below. Our passing model failed its calibration test; we publish that on the accuracy page.
Expected volume from the inputs above. Unvalidated — it is arithmetic on what has already happened, not a forecast that has been scored against outcomes.
The market has his team at 24.0 points implied.
What he has actually cleared
175.5 yards in 5 of 5200.5 yards in 3 of 5225.5 yards in 2 of 5
The index ranks this quarterback and this matchup against every qualifying passer, over games already played. It is not a probability and not a bet — our passing-yards model failed its calibration test, and we publish that on the accuracy page.
QB Index · vs NE
Tyson Bagent
CHI · 3 games, 64 attempts
23
index
F
Volumeweight 0.40
32nd of 34
21.3 attempts per game · team runs 71 plays at 48% pass · sacked on 5.9% of dropbacks
Efficiencyweight 0.35
24th of 34
6.4 yards per attempt · 65.6% completions · -0.077 EPA per dropback
Matchupweight 0.25
20th of 32
NE has allowed 6.9 yards per attempt across 5 games
≈ 207 yards32 attempts × 6.4 yards per attempt
Expected volume from the inputs above. Unvalidated — it is arithmetic on what has already happened, not a forecast that has been scored against outcomes.
The market has his team at 26.5 points implied.
What he has actually cleared
100.5 yards in 1 of 3
The index ranks this quarterback and this matchup against every qualifying passer, over games already played. It is not a probability and not a bet — our passing-yards model failed its calibration test, and we publish that on the accuracy page.
10
390 of 6,967
4
341 of 6,967
14
334 of 6,967
Across 6,967 regular-season games since 1999, 24 of 28 spread rungs with a usable sample had a 95% interval containing 50%. In other words the number itself has never been an edge, at any rung, in twenty-seven seasons. What it is good for is knowing which numbers are expensive to cross — and a rung holding fewer than 30 games is shown greyed rather than dropped.
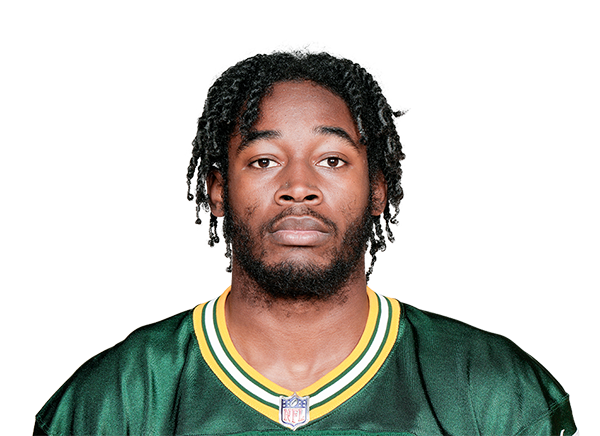 Romeo Doubs15.3% target share · 11.7 PPR last 4
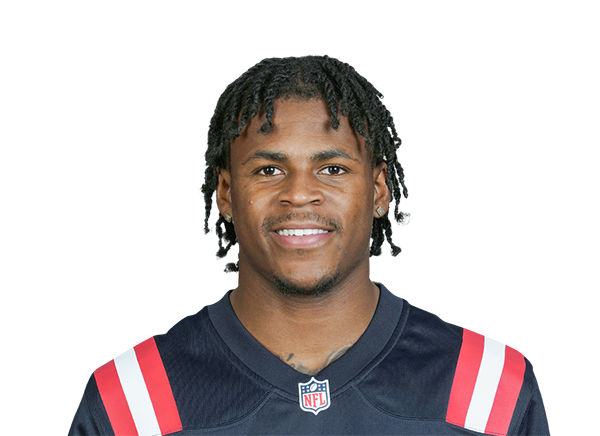 DeMario Douglas14.7% target share · 8.2 PPR last 4
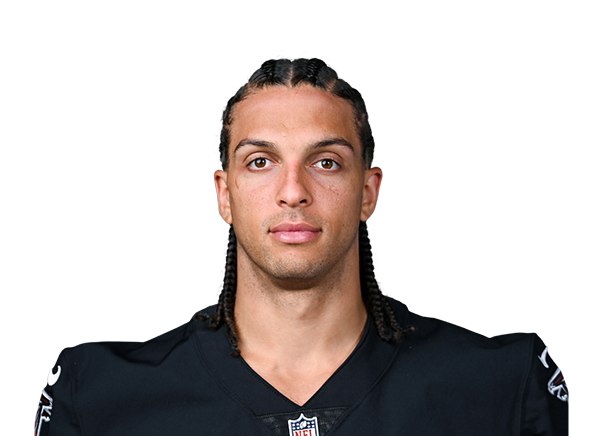 Mack Hollins13.3% target share · 9 PPR last 4
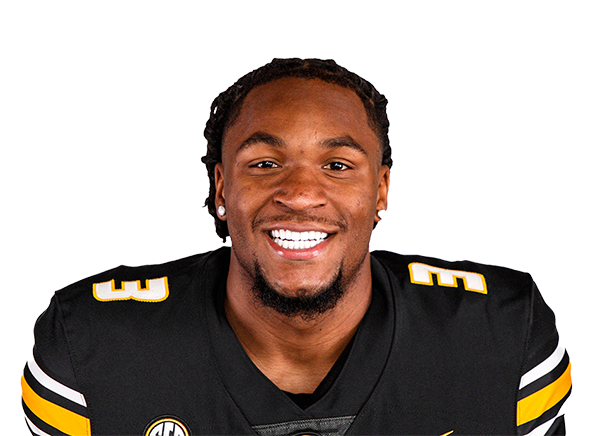 Luther Burden III21.7% target share · 11.6 PPR last 4
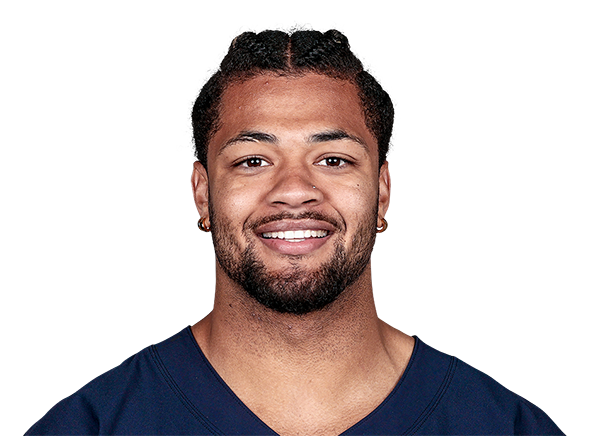 Rome Odunze18.0% target share · 8.8 PPR last 4
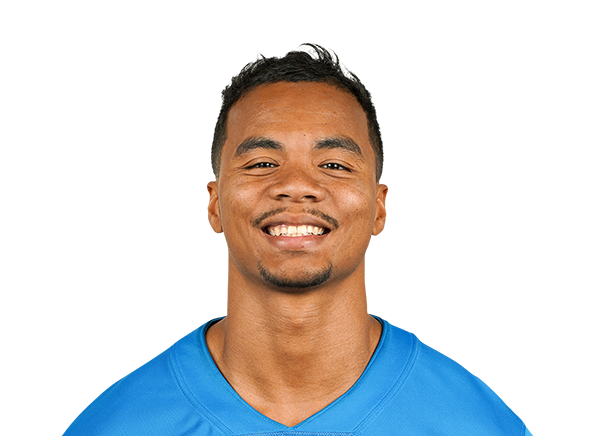 Kalif Raymond16.8% target share · 9 PPR last 4
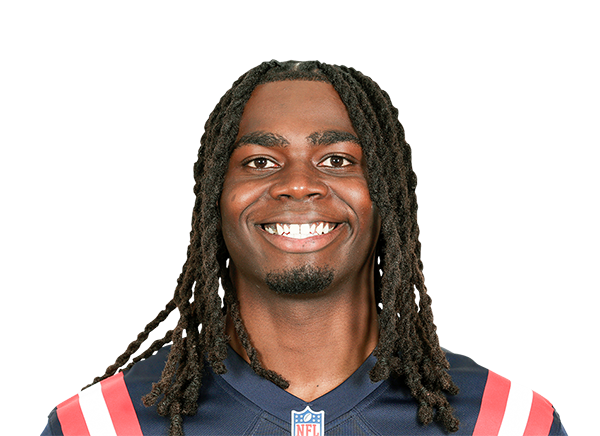 Rhamondre Stevenson39.9% of team carries · 11.6 PPR last 4
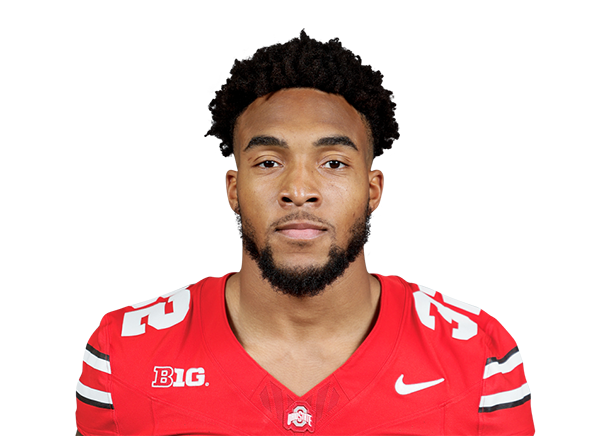 TreVeyon Henderson29.4% of team carries · 6.6 PPR last 4
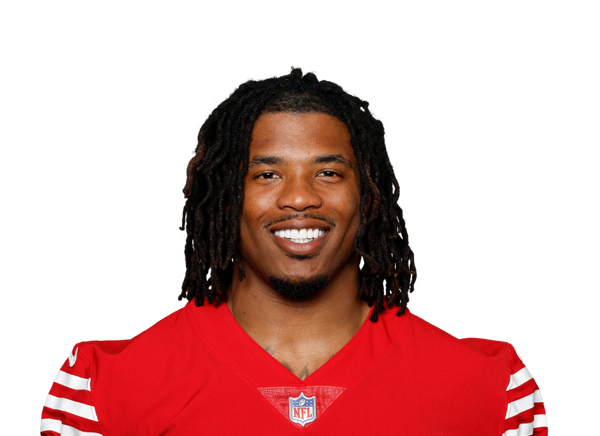 Corey Kiner14.0% of team carries · 2.2 PPR last 4
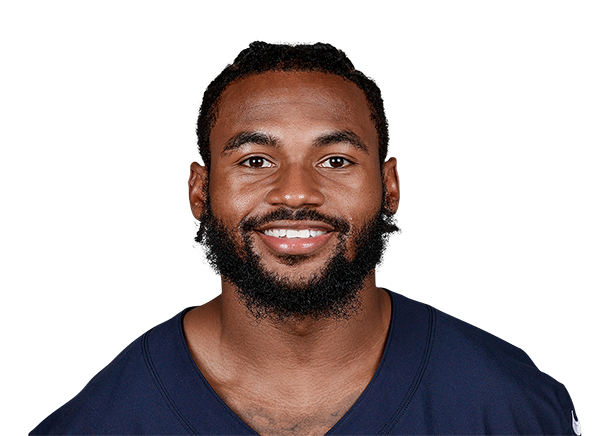 D'Andre Swift45.9% of team carries · 12.1 PPR last 4
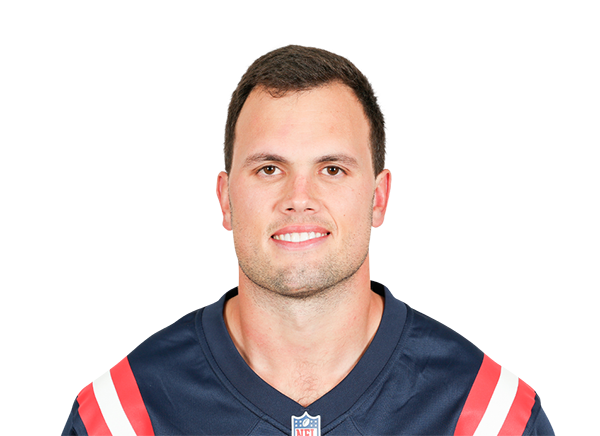 Hunter Henry12.7% target share · 8.3 PPR last 4
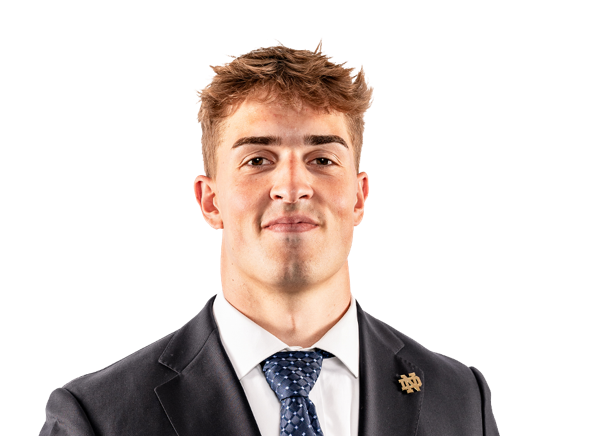 Eli Raridon6.0% target share · 6 PPR last 4
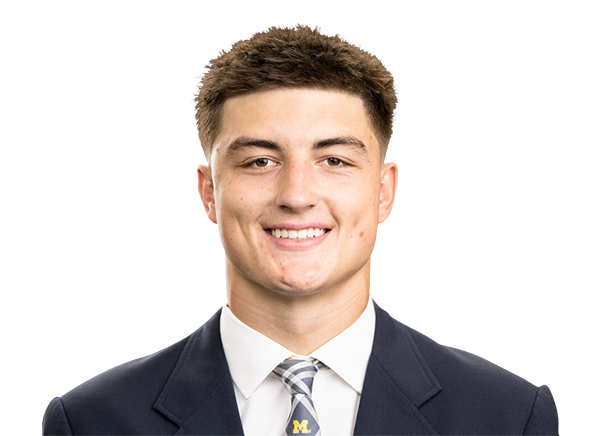 Colston Loveland14.3% target share · 6 PPR last 4
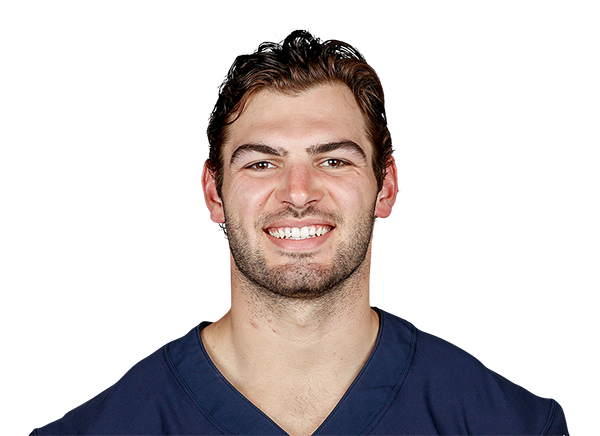 Cole Kmet5.6% target share · 1.3 PPR last 4