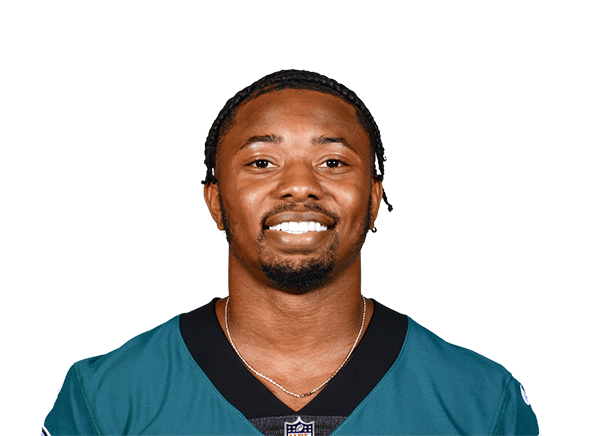
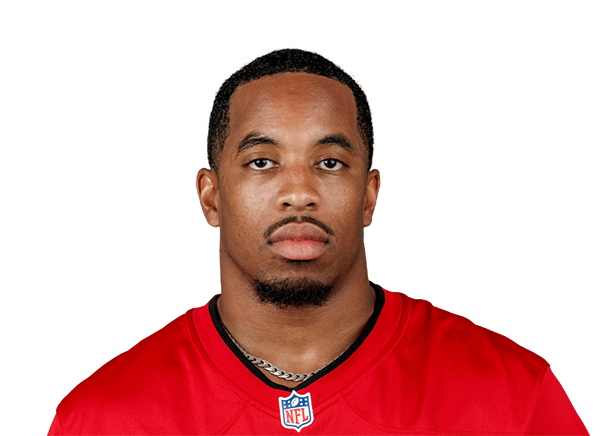
Final · Minnesota Vikings 23, Tampa Bay Buccaneers 16
Opened
-1.5
First seen Jul 29
Closed
+3.5
+5 since open
Total
36.5
Prices archived
91
15 spread · 13 total
Crossed 3 since opening0.5 points past 3
What the market says
Both prices with the bookmaker's margin removed. This is the market's number, not ours — we don't forecast NFL games, and we publish why.
MIN
71.8%
TB
28.2%
Teams the market priced at 70–75% won 527 of 722 games since 1999.That is almost exactly what the price claimed — this market prices accurately.
6.0%the book's margin on this game
The two prices add up to 106.0%. Everything over 100% is the book's edge, taken whichever side you pick.
Head to head
Kyler Murray · MINQB Index componentsBaker Mayfield · TB
34 · F
Index
36 · D
25.3
Attempts / gm
32.0
8.2%
Sacked
share of dropbacks
11.9%
68.3%
Completion
QB Index · vs TB
Kyler Murray
MIN · 4 games, 101 attempts
34
index
F
Volumeweight 0.40
30th of 34
25.3 attempts per game · team runs 58 plays at 48% pass · sacked on 8.2% of dropbacks
Efficiencyweight 0.35
18th of 34
6.6 yards per attempt · 68.3% completions · -0.076 EPA per dropback
Matchupweight 0.25
16th of 32
TB has allowed 7.1 yards per attempt across 5 games
≈ 169 yards
The life of this number
Following the DraftKings spread · one of 2 books archived · 5 prices on record
Open
Opened -1.5 on Wed, Jul 29, 60 days before kickoff.
Move
4 reprices since, 17 points of movement in all. It closed +3.5 — the favourite changed sides. It ranged from -1.5 to +6.5 along the way, retracing 12 points of that movement.
When it moved
Half of the movement was over by Sun, Sep 27, 6 PM ET.
18% 5–2 days out82% Gameday
Biggest move
8 points at once — -1.5 to +6.5 on Sun, Sep 27, 6 PM ET.
Crossed 3
-1.5 to +6.5 on Sun, Sep 27, 6 PM ET — through 3 and away from it.
Every sentence above is arithmetic on prices we recorded and the times we recorded them. Nothing here says where this number goes next.
The life of this number
Following the DraftKings total · one of 2 books archived · 6 prices on record
Open
Opened 44.5 on Wed, Jul 29, 60 days before kickoff.
Move
5 reprices since, 14 points of movement in all. It closed 36.5 — 8 points lower than the open. It ranged from 36.5 to 45.5 along the way, retracing 6 points of that movement.
When it moved
Half of the movement was over by Sun, Sep 27, 6 PM ET.
14% 5–2 days out86% Gameday
Biggest move
7 points at once — 43.5 to 36.5 on Sun, Sep 27, 7 PM ET.
Every sentence above is arithmetic on prices we recorded and the times we recorded them. Nothing here says where this number goes next.
What happened at this number
Counts from 6,967 regular-season games since 1999. No model, no forecast — this is the history of the number itself, not a claim about this game.
The spread
Favourites of 3.5 covered 325 of 656 games.
The range covers a coin flip.
They won outright in 414 of 656.
The total
Totals of 36.5 went over 64 of 126 times.
The range covers a coin flip.
How often a game ends on each margin
3
1,046 of 6,967
7
634 of 6,967
6
415 of 6,967
The spread, hour by hour
Home handicap. Dashed rules are the key numbers.
DraftKingsFanDuel
Hover or drag to replay
The total
Over line.
DraftKingsFanDuel
Hover or drag to replay
Player props · 54
Aaron Jones
Carries
15.5market 50% over
we project19.4/gm± 3.0 typical error
over
-116
DraftKings
under
-116
DraftKings
Aaron Jones
Receiving Yards
12.5market 51% over
over
-113
FanDuel
under
-108
DraftKings
Aaron Jones
Receptions
1.5market 47% over12.4pp between books — shop it
over
+100
DraftKings
under
+124
FanDuel
Aaron Jones
Rushing Yards
57.5market 49% over
we project82.0/gm± 15.2 typical error
over
-111
DraftKings
under
-118
FanDuel
Al-Quadin Muhammad
Sacks
0.5
over
+178
FanDuel
under
—
Andrew Van Ginkel
Sacks
0.5
over
+144
FanDuel
under
—
Baker Mayfield
Completions
19.5market 49% over
over
-111
DraftKings
under
-120
DraftKings
Baker Mayfield
Interceptions
0.5market 38% over
over
+150
DraftKings
under
-200
DraftKings
Baker Mayfield
Pass Attempts
31.5market 50% over
we project32.0/gm± 3.0 typical error
over
-116
DraftKings
under
-116
DraftKings
Baker Mayfield
Passing TDs
1.5market 41% over13.0pp between books — shop it
over
+240
DraftKings
under
+140
DraftKings
Baker Mayfield
Passing Yards
217.5market 50% over
over
-111
DraftKings
under
-114
DraftKings
Baker Mayfield
Rushing Yards
14.5market 49% over19.7pp between books — shop it
we project21.7/gm± 4.9 typical error
over
+210
DraftKings
under
-122
FanDuel
Blake Cashman
Sacks
0.5
over
+270
FanDuel
under
—
Bucky Irving
Carries
16.5market 45% over
we project15.4/gm± 3.0 typical error
over
+105
DraftKings
under
-141
DraftKings
Bucky Irving
Receiving Yards
12.5market 50% over
over
-110
FanDuel
under
-120
DraftKings
Bucky Irving
Receptions
2.5market 53% over
over
-130
FanDuel
under
+100
DraftKings
Bucky Irving
Rushing Yards
55.5market 50% over
we project81.2/gm± 15.2 typical error
over
-112
FanDuel
under
-111
DraftKings
Cade Otton
Receiving Yards
69.5market 36% over23.0pp between books — shop it
we project36.4/gm± 12.5 typical error
over
+230
DraftKings
under
-114
FanDuel
Cade Otton
Receptions
3.5market 51% over23.0pp between books — shop it
over
+134
FanDuel
under
-175
DraftKings
Chase McLaughlin
Kicking Points
6.5market 54% over
over
-137
DraftKings
under
+107
DraftKings
Chris Godwin
Receiving Yards
35.5market 50% over
we project35.8/gm± 12.5 typical error
over
-114
DraftKings
under
-111
DraftKings
Chris Godwin
Receptions
3.5market 49% over11.4pp between books — shop it
over
+120
FanDuel
under
-147
DraftKings
Dallas Turner
Sacks
0.5
over
-114
FanDuel
under
—
Emeka Egbuka
Receiving Yards
47.5market 50% over
we project38.4/gm± 12.5 typical error
over
-111
DraftKings
under
-114
FanDuel
Emeka Egbuka
Receptions
4.5market 52% over9.7pp between books — shop it
over
+118
FanDuel
under
-105
DraftKings
Jalen McMillan
Receiving Yards
13.5market 51% over
over
-116
DraftKings
under
-109
DraftKings
Jalen McMillan
Receptions
1.5market 41% over
over
+130
FanDuel
under
-167
DraftKings
Jauan Jennings
Receiving Yards
13.5market 51% over
over
-114
FanDuel
under
-109
DraftKings
Jauan Jennings
Receptions
1.5market 59% over12.7pp between books — shop it
over
-102
FanDuel
under
+125
DraftKings
Jordan Addison
Receiving Yards
41.5market 50% over
we project40.8/gm± 12.5 typical error
over
-114
FanDuel
under
-114
FanDuel
Jordan Addison
Receptions
4.5market 44% over
over
+110
DraftKings
under
-147
DraftKings
Josh Oliver
Receiving Yards
10.5market 50% over
over
-114
FanDuel
under
-111
DraftKings
Josh Oliver
Receptions
1.5market 35% over9.0pp between books — shop it
over
+165
DraftKings
under
-148
FanDuel
Justin Jefferson
Receiving Yards
71.5market 50% over
we project64.5/gm± 12.5 typical error
over
-112
DraftKings
under
-112
DraftKings
Justin Jefferson
Receptions
5.5market 55% over2.7pp between books — shop it
over
-141
DraftKings
under
+118
FanDuel
Kenneth Gainwell
Receiving Yards
9.5market 50% over
over
-114
DraftKings
under
-111
DraftKings
Kenneth Gainwell
Receptions
1.5market 37% over22.3pp between books — shop it
over
+155
DraftKings
under
+120
FanDuel
Kenneth Gainwell
Rushing Yards
18.5market 51% over
over
-113
FanDuel
under
-110
DraftKings
Kyler Murray
Carries
5.5market 50% over
we project5.0/gm± 0.7 typical error
over
-116
DraftKings
under
-116
DraftKings
Kyler Murray
Completions
15.5market 55% over
over
-141
DraftKings
under
+105
DraftKings
Kyler Murray
Interceptions
0.5market 41% over
over
+130
DraftKings
under
-175
DraftKings
Kyler Murray
Pass Attempts
24.5market 49% over
we project25.3/gm± 3.0 typical error
over
-111
DraftKings
under
-125
DraftKings
Kyler Murray
Passing TDs
1.5market 40% over
over
+134
FanDuel
under
-172
DraftKings
Kyler Murray
Passing Yards
209.5market 50% over
over
-113
FanDuel
under
-111
DraftKings
Kyler Murray
Rushing Yards
20.5market 51% over
we project23.3/gm± 4.9 typical error
over
-113
FanDuel
under
-109
DraftKings
T.J. Hockenson
Receiving Yards
29.5market 50% over
we project40.4/gm± 12.5 typical error
over
-112
FanDuel
under
-118
FanDuel
T.J. Hockenson
Receptions
3.5market 58% over9.7pp between books — shop it
over
-112
FanDuel
under
+120
DraftKings
Ted Hurst
Receiving Yards
56.5market 50% over
we project32.0/gm± 12.5 typical error
over
-116
DraftKings
under
-120
DraftKings
Ted Hurst
Receptions
2.5market 43% over
over
+115
DraftKings
under
-156
DraftKings
Ted Hurst III
Receiving Yards
50.5market 50% over
we project32.0/gm± 12.5 typical error
over
-114
FanDuel
under
-114
FanDuel
Ted Hurst III
Receptions
2.5market 42% over
over
+120
FanDuel
under
-160
FanDuel
Vita Vea
Sacks
0.5
over
+350
FanDuel
under
—
Will Reichard
Kicking Points
7.5market 45% over
over
+111
DraftKings
under
-143
DraftKings
Yaya Diaby
Sacks
0.5
over
+140
FanDuel
under
—
Every number here is a price we observed or arithmetic on prices we observed. “Market %” is the book's own two-sided price with the vig removed — not a forecast. We publish no prop projection: the model failed its pre-registered calibration gate on 2026-07-31, and a number that failed its own test doesn't go on the site.
Every point above is a price we observed and stored, with the time we saw it. Nothing on this page is a prediction, a rating, or a recommended bet.
63.5%
6.6
Yards / att
6.4
158.5
Air yards / gm
284.0
-0.076
EPA / dropback
-0.274
+5.4
CPOE
completion % over expected
+1.1
Every row is a rate measured over games already played, never a probability — the same components behind each quarterback's Index below. Our passing model failed its calibration test; we publish that on the accuracy page.
Expected volume from the inputs above. Unvalidated — it is arithmetic on what has already happened, not a forecast that has been scored against outcomes.
The market has his team at 20.0 points implied.
What he has actually cleared
200.5 yards in 2 of 4225.5 yards in 2 of 4250.5 yards in 0 of 4
The index ranks this quarterback and this matchup against every qualifying passer, over games already played. It is not a probability and not a bet — our passing-yards model failed its calibration test, and we publish that on the accuracy page.
QB Index · vs MIN
Baker Mayfield
TB · 3 games, 96 attempts
36
index
D
Volumeweight 0.40
15th of 34
32.0 attempts per game · team runs 57 plays at 53% pass · sacked on 11.9% of dropbacks
Efficiencyweight 0.35
26th of 34
6.4 yards per attempt · 63.5% completions · -0.274 EPA per dropback
Matchupweight 0.25
26th of 32
MIN has allowed 6.3 yards per attempt across 5 games
≈ 170 yards27 attempts × 6.4 yards per attempt
Expected volume from the inputs above. Unvalidated — it is arithmetic on what has already happened, not a forecast that has been scored against outcomes.
The market has his team at 16.5 points implied.
What he has actually cleared
200.5 yards in 2 of 3225.5 yards in 0 of 3250.5 yards in 0 of 3
The index ranks this quarterback and this matchup against every qualifying passer, over games already played. It is not a probability and not a bet — our passing-yards model failed its calibration test, and we publish that on the accuracy page.
10
390 of 6,967
4
341 of 6,967
14
334 of 6,967
Across 6,967 regular-season games since 1999, 24 of 28 spread rungs with a usable sample had a 95% interval containing 50%. In other words the number itself has never been an edge, at any rung, in twenty-seven seasons. What it is good for is knowing which numbers are expensive to cross — and a rung holding fewer than 30 games is shown greyed rather than dropped.
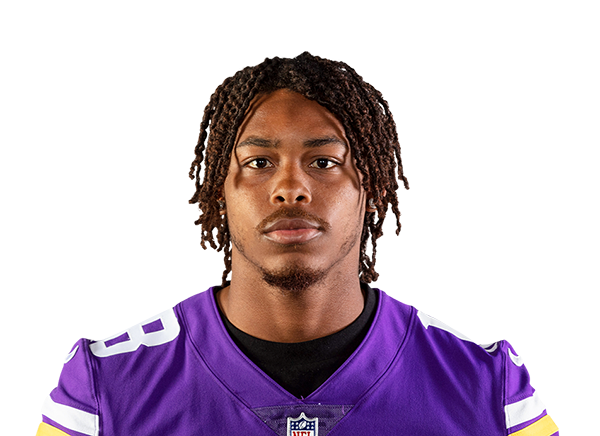 Justin Jefferson19.2% target share · 15.9 PPR last 4
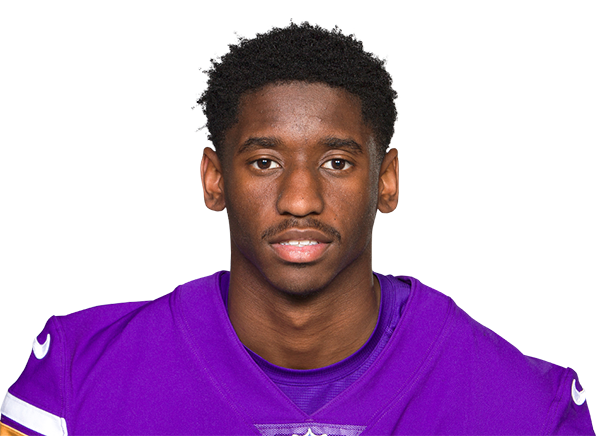 Jordan Addison16.9% target share · 8.3 PPR last 4
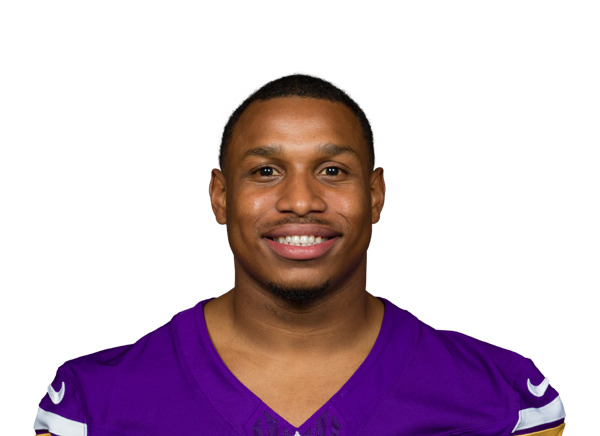 Myles Price5.4% target share · 3 PPR last 4
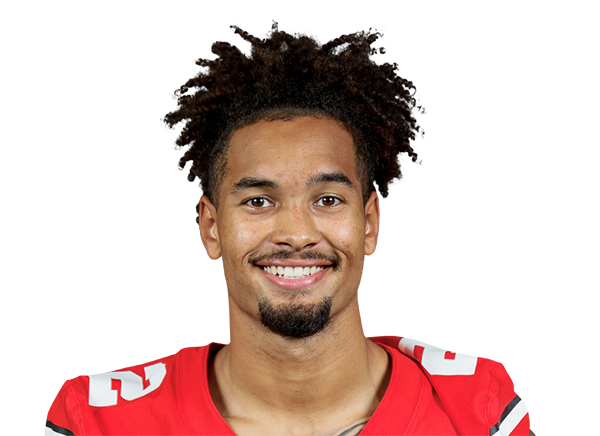 Emeka Egbuka22.6% target share · 10.5 PPR last 4
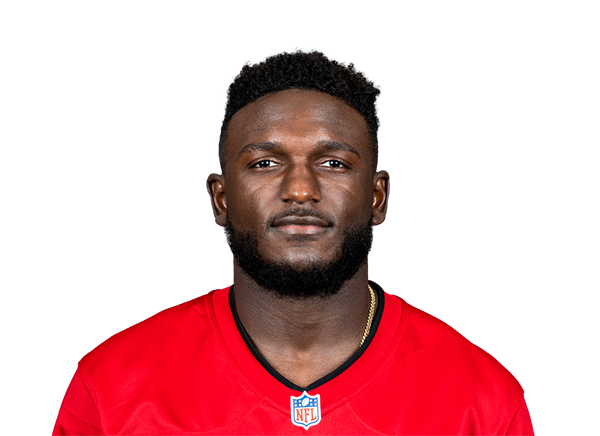 Chris Godwin Jr.14.4% target share · 7.6 PPR last 4
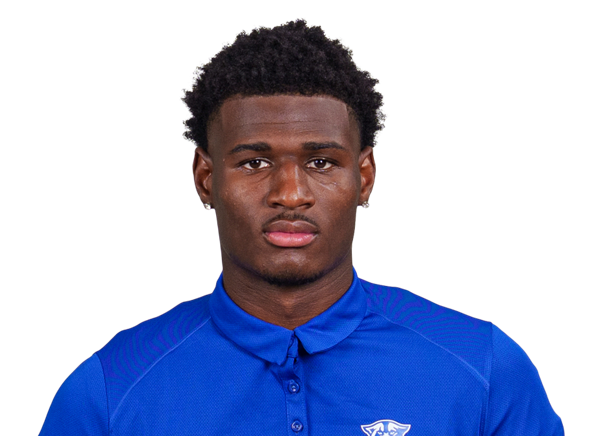 Ted Hurst III11.0% target share · 6.7 PPR last 4
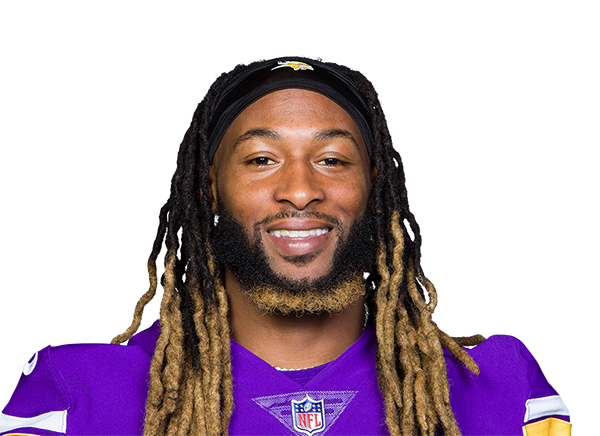 Aaron Jones67.8% of team carries · 15.1 PPR last 4
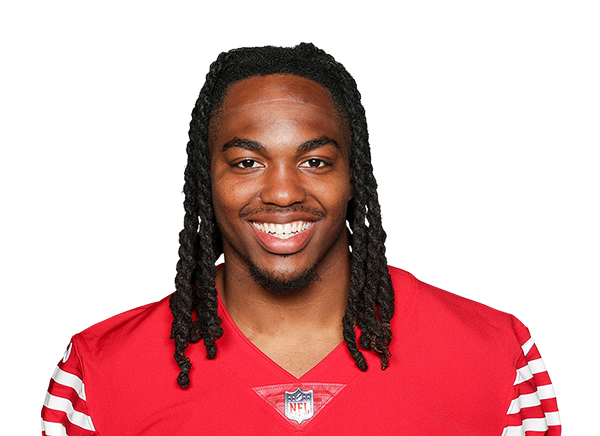 Jordan Mason10.5% of team carries · 11.9 PPR last 1
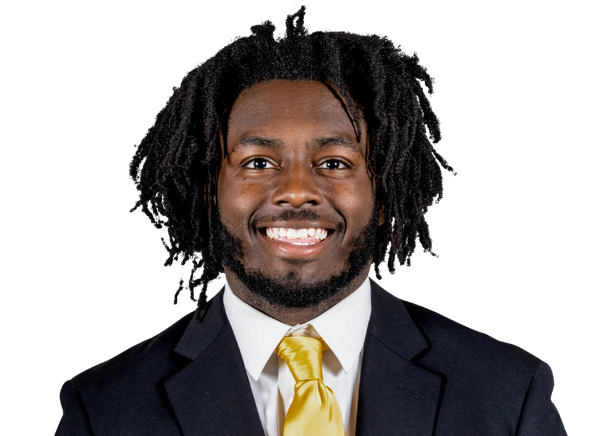 Demond Claiborne4.2% of team carries · 1 PPR last 4
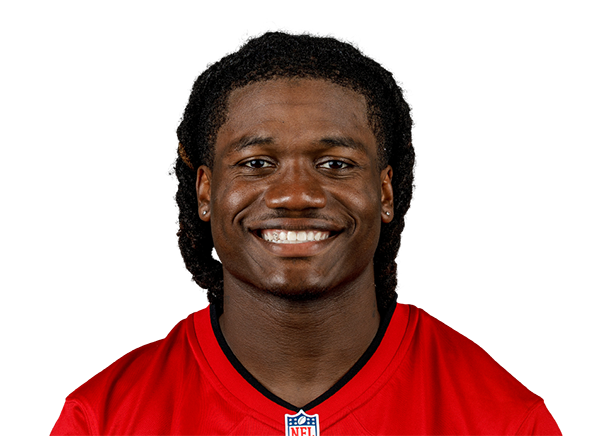 Bucky Irving57.9% of team carries · 14.6 PPR last 4
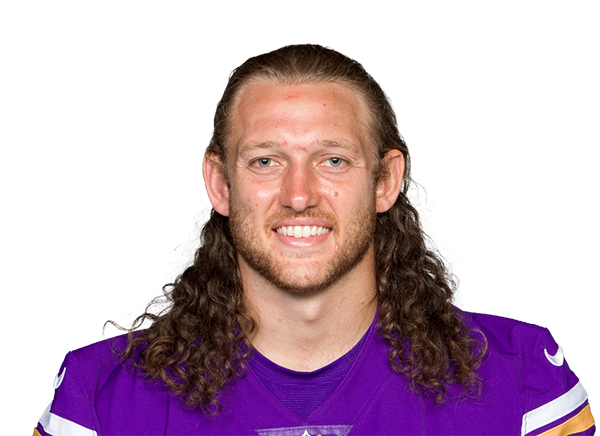 T.J. Hockenson20.8% target share · 8.9 PPR last 4
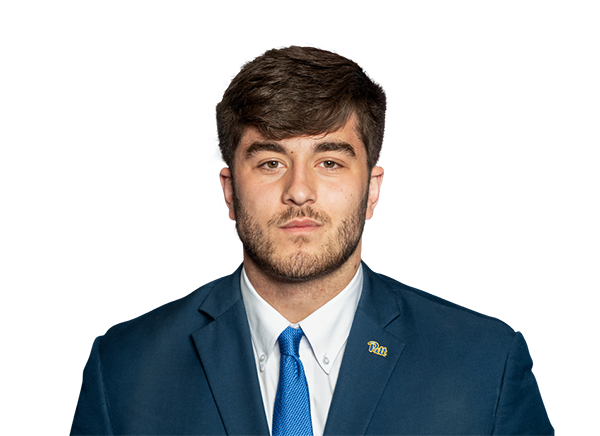 Gavin Bartholomew5.4% target share · 4.9 PPR last 2
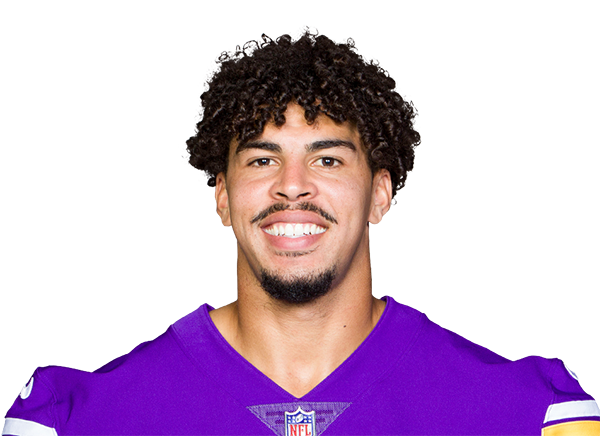 Josh Oliver3.8% target share · 2.5 PPR last 3
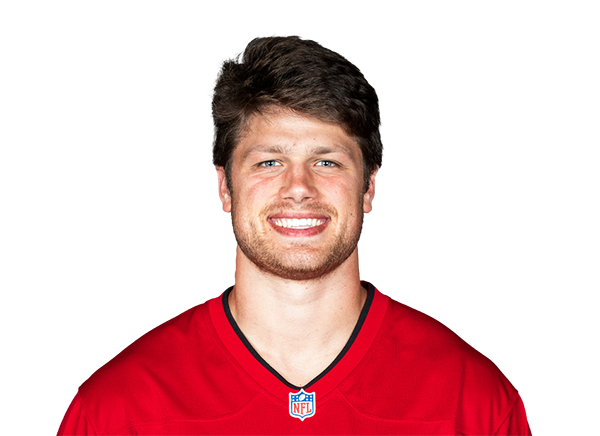 Cade Otton18.5% target share · 7.6 PPR last 4